This section provides an overview of all 520 active attacks occurring between 2000 and 2022. Data are presented detailing the event, victims, attacker, and how the events were resolved. It should be noted that these data are generally rounded to the nearest whole number. Please reach through the Data Requests tab if you would like any specific graphics created or a copy of the data.
Rolling Map.
Event Location (Visual). The video below presents a visual of where active attacks have occurred.
Event.
Attack Frequency. The graphic below represents the frequency of active attacks from 2000 to 2022. There appears to be more events in the last five years (mean = 45) than the first five years (mean = 8) or second five years (mean = 13); however, this may be an artifact of media coverage. Events that occurred during the first part of this data collection period likely did not get the national coverage that they do now. Furthermore, technology and search engines have improved dramatically over the 23 years of this data collection period.

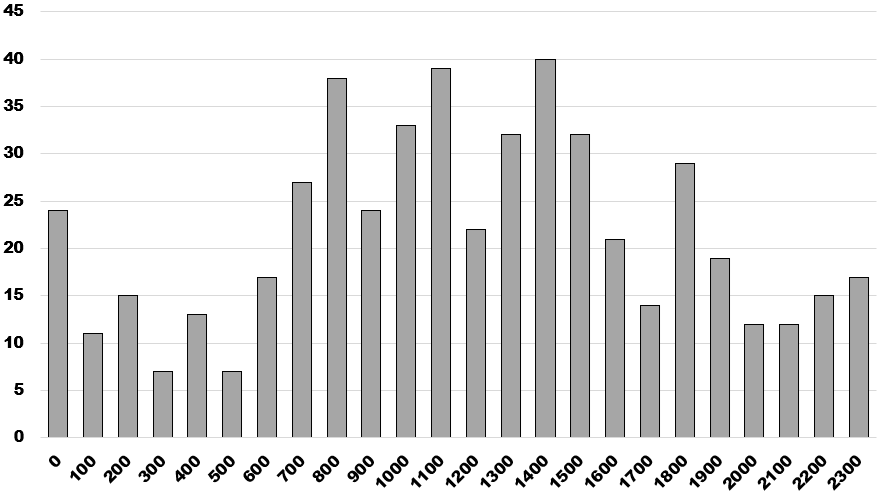
Time of Day. The bulk of attacks happen between the hours of 7:00 am and 4:00 pm (59%). However, as the below graphic shows, attacks occur at all times of the day.
Location. As seen here, the plurality of events happen at places of business (n = 247, 47.50%). Places of business include factories/warehouse, retail locations, and office space. One hundred and twenty-six attacks (24%) happened in public (outdoor) spaces. For instance, on January 8, 2011 a shooter attacked a meeting for U.S. Representative Gabrielle Giffords. This attack happened in the parking lot of a local grocery store. Had the attack happened in the store it would have been classified as a business event; however, since the attack occurred in the parking lot it is coded as a public event.
Schools were attacked 73 times (14%). These events are aggregated and include attacks on all types of educational facilities, including K-12 and institutes of higher education. Lastly, 74 attacks (14%) happened at "Other" locations with 19 occurring at houses of worship.

Victims.
Number of Victims. There were 3,675 people injured in active attacks. Of these, 1,277 people died and 2,398 were wounded. Because the distribution of the data is not normal, the median (or middle value) is the best measure to summarize the average number wounded. The median number of people wounded was 2. The median number of deaths was 1.
Of the total events, only 31% of the events would qualify as mass murder under the current federal definition. This shows the majority of events are small-scale attacks and not mass casualty incidents.

Attacker.
Demographics. Many in the media attempt to create a profile describing the “average” attacker. The data do not support a profile beyond sex and number of attackers. The data show the attacker is male 97% of the time. Furthermore, the attacker commits the attack by him/herself 98% of the time. The only profile is the attacker is likely a solo male.
The attacker’s race roughly follows the racial distribution of the United States population. There were 253 Caucasian attackers (49%). This is followed by 154 African American attackers (30%). The attackers range in age from 12 to 88 years old. The median age of an attacker is 33 years old. As these data show – there is no other profile for attackers.

Weaponry. As these data cover active attacks, there are a variety of weapons utilized by the attacker. A firearm was used in 485 of the 520 attacks (93%). Bladed weapons were used in 24 (5%) of the attacks. There were also 11 vehicle attacks (2%).
Firearms make up a majority of the weapons used to carry out an attack. For this reason, we will disaggregate the firearm category. A pistol was the most powerful weapon used in the majority (n = 287; 59%) of the firearm attacks. Shotguns were used in 45 (9%) of the attacks and rifles in 146 (30%). In seven cases (1%), an unknown type of firearm was used.
In 33% of the events (n = 170), the attacker carried multiple weapons.

Other Equipment. Twenty attackers (4%) wore body armor while carrying out the attacks.
Relationship to Victims. The below graphic illustrates the relationship between the attacker and his/her victims. The attacker did not have a discernible relationship to their victims in 61% of the events (n = 319). The attacker was a current or former coworker in 90 (17%) events and a current or former student in 63 (12%) events. In the remaining events, the attacker’s relationship varied between members of an attacked church, secondary relationships (e.g., employee at spouse’s workplace) or simply unknown.

Resolution.
We consider an event to be resolved when the attacker stopped actively trying to kill people. We split the resolution of the event into two broad time frames. These were whether the event was resolved before the police arrived on scene or after. In the cases where we were able to make this determination, the attack was over before the police arrived about half of the time (i.e., 297 times the event ended prior to law enforcement arrival, and 223 times it ended after law enforcement arrival).
The below graphic illustrates how these events were resolved. In the 297 events that ended before the police arrived, the attacker stopped the attack by killing himself on 76 occasions (15%) and simply left the scene in 143 cases (28%). The potential victims at the attack site stopped the attacker themselves in 78 cases (15%). In 59 of these cases, they physically subdued the attacker. In the other 26 cases, they shot the attacker.
When the attack ended after the law enforcement arrived, the attacker was more likely to be stopped by law enforcement than stopping him/herself. The attacker committed suicide in 46 instances (9%) and surrendered in 17 (3%). Law enforcement shot the attacker to resolve the event in 114 cases (22%) and subdued the attacker using other methods in 46 (9%). This means that law enforcement directly stops the attacker in 31% of active attacks.
